 Product Overview
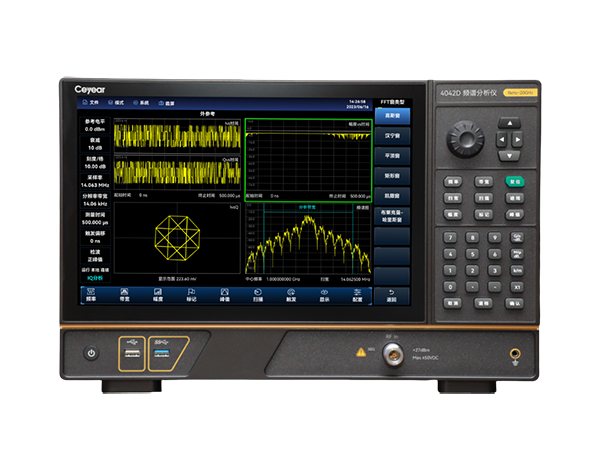
Ceyear 4042 series spectrum analyzer is a new entry-level spectrum analysis instrument launched by Ceyear, offering a frequency measurement range from 9kHz to 20GHz. Designed with a portable structure and weighing less than 6.5kg, the 4042 series features a wide operating frequency band, high performance specifications, fast scanning speed, multiple test functions, and convenient portability.
4042 series analyzer supports various measurement modes such as real-time spectrum analysis, interference analysis, channel scanning, field strength measurement, USB continuous wave (CW) and peak power measurement, analog demodulation analysis, and IQ analysis. It also includes intelligent measurement functions like channel power, occupied bandwidth (OBW), adjacent channel power ratio (ACPR), spectrum emission mask (SEM), carrier-to-noise ratio (C/N), harmonic distortion, and spurious emission templates.
Equipped with digital interfaces including LAN, USB, and HDMI, 4042 series also features a 12.1-inch multi-touch capacitive touchscreen, delivering an enhanced user interaction experience. The product is widely applicable in fields such as R&D and testing of industrial electronics, communication testing, satellite communications, microwave communications, and scientific research and teaching.
Key Features
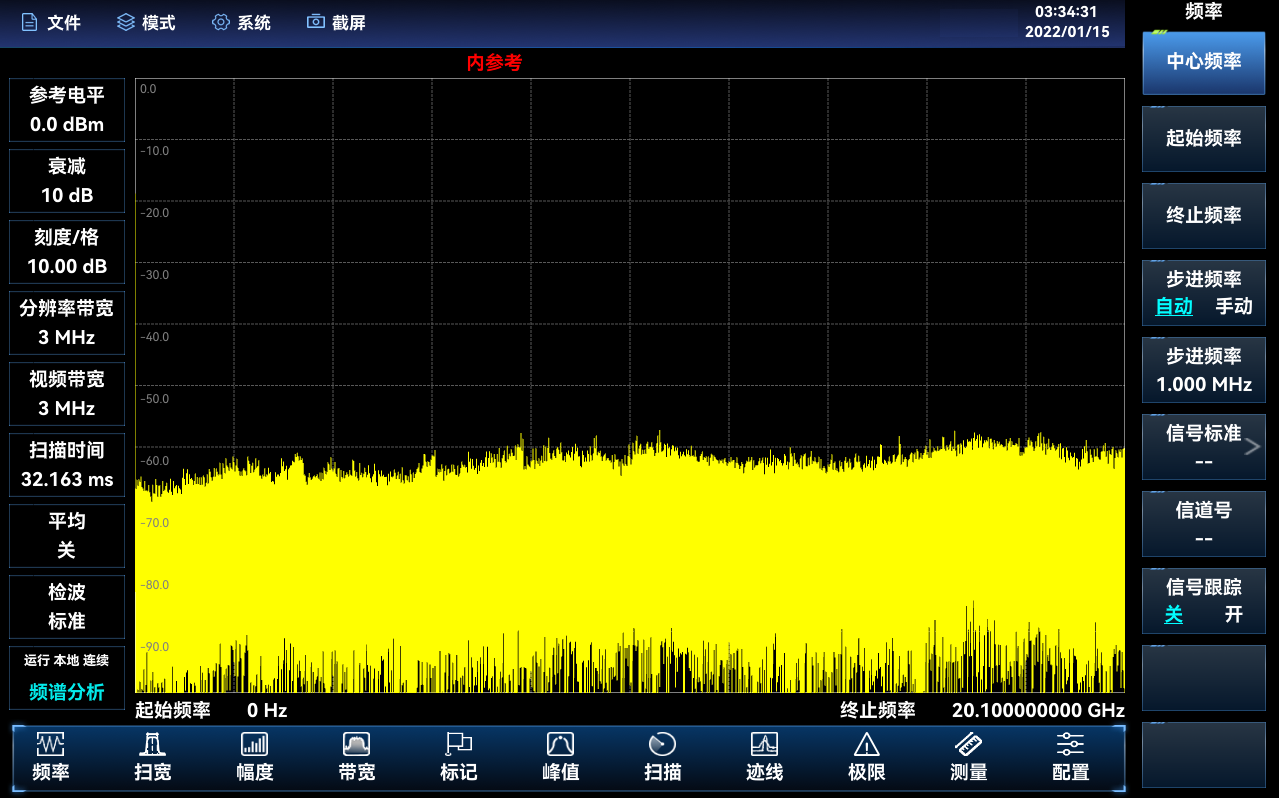
Rich Measurement Options – Spectrum Analysis
4042 series spectrum analyzer offers a variety of test functions including channel power, occupied bandwidth (OBW), adjacent channel power (ACPR), spectrum emission mask, carrier-to-noise ratio (C/N), audio demodulation, harmonic distortion, and multi-carrier adjacent channel power measurement. It supports noise marker and frequency counter functions, can display up to three traces simultaneously, and provides multiple detection methods including Normal, +Peak, -Peak, Sample, Average, and RMS. The instrument also supports signal tracking and peak tracking functions for enhanced signal analysis.
|
|
|
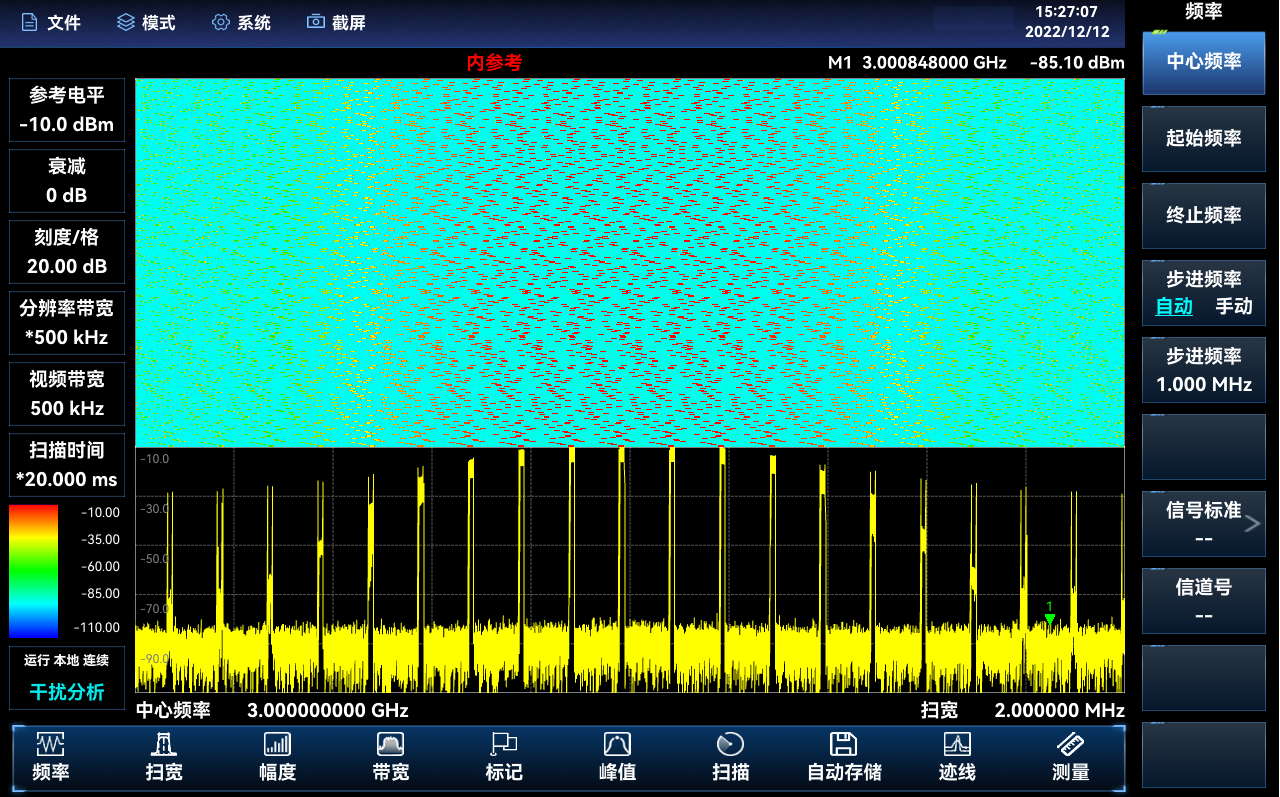
Rich Measurement Options – Interference Analysis (Optional)
The interference analysis option includes functions for spectrum measurement, waterfall display, and RSSI (Received Signal Strength Indicator) measurement. The waterfall diagram presents data in a three-dimensional format—frequency, amplitude, and time—making it easy to observe periodic or intermittent signals. In the waterfall display, color variations represent differences in signal amplitude. RSSI is primarily used to measure the strength variation of a fixed-frequency signal over a period of time. Both the waterfall display and RSSI measurement support automatic signal storage functionality.
|
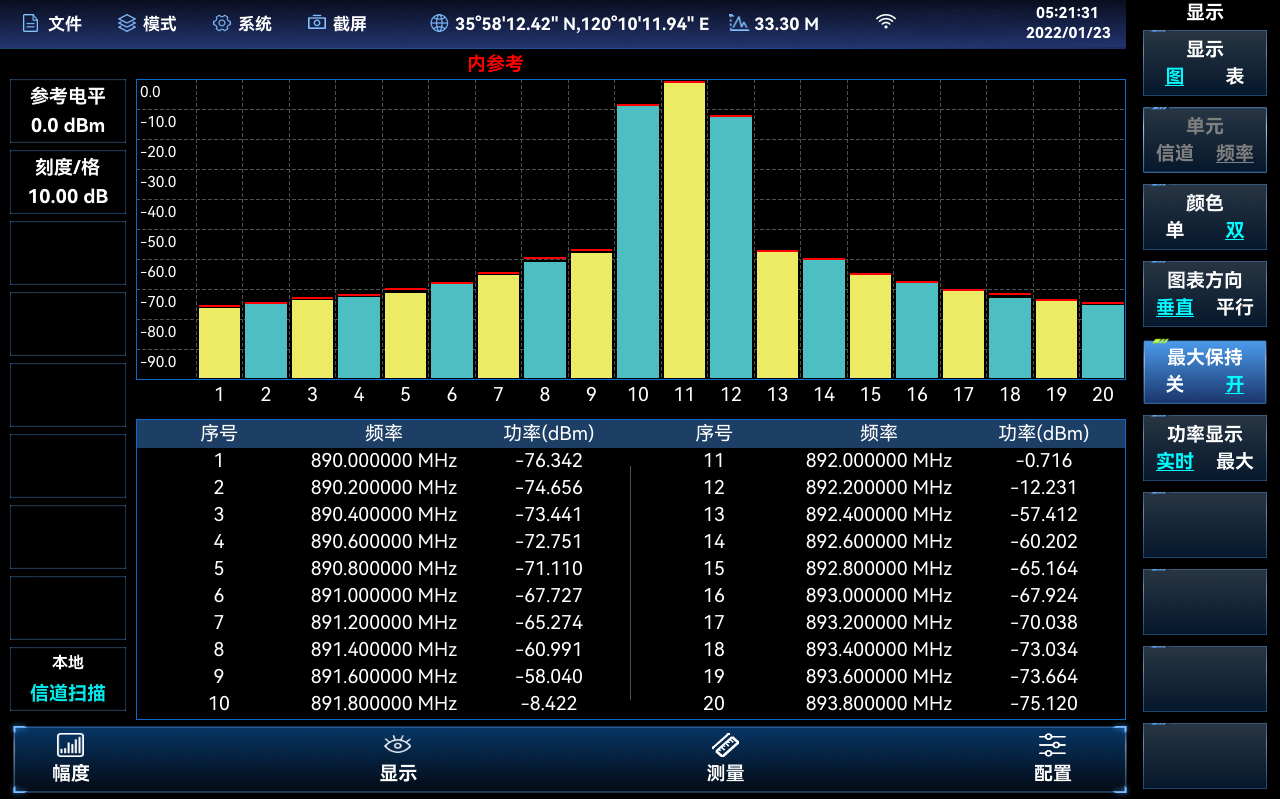
Rich Measurement Options – Channel Scan (Optional)
The channel scan measurement mode enables the measurement of signal power across multiple channels. The signal power can be displayed in either bar chart or list format, with support for measuring up to 20 channels simultaneously. Depending on the method of channel configuration, there are three measurement modes available: Channel Scan, Frequency Scan, and List Scan. In all three modes, users can set the channel bandwidth and the number of channels.
|
|
|
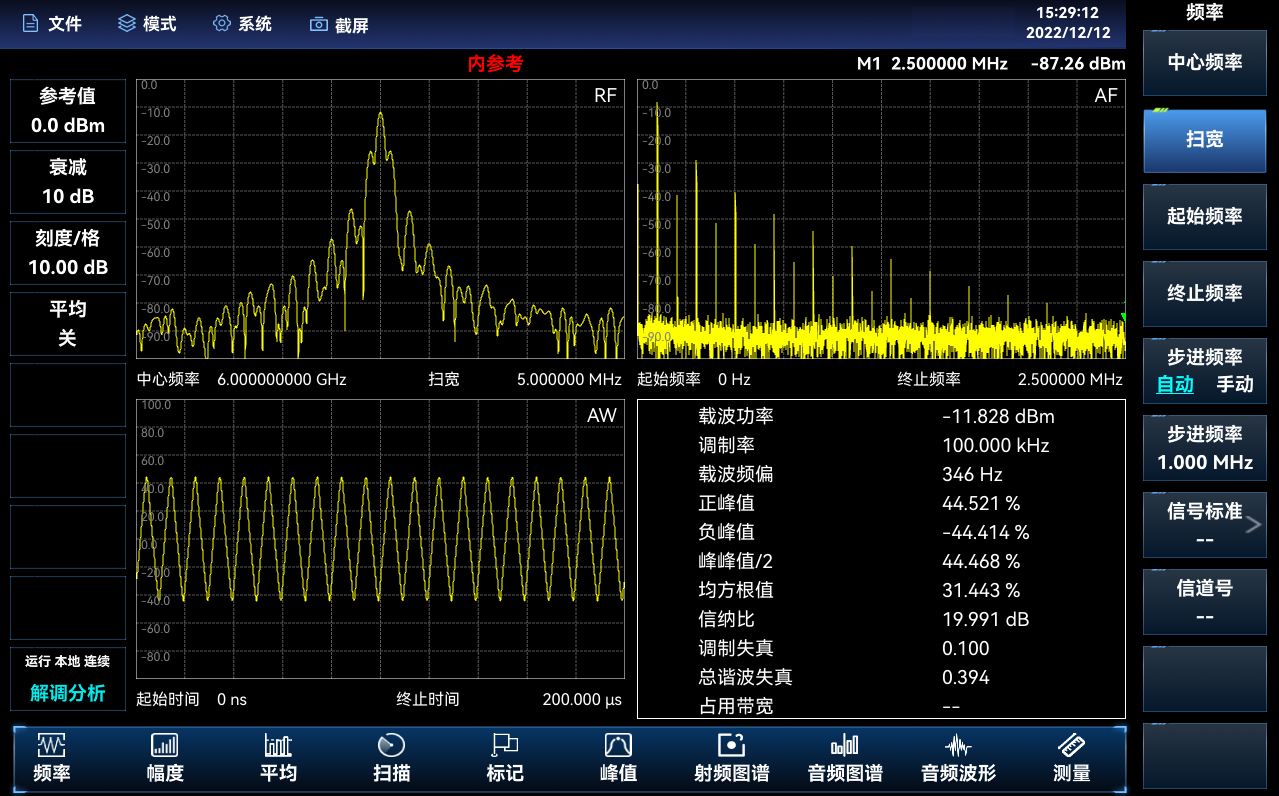
Rich Measurement Options – Analog Demodulation Analysis (Optional)
The demodulation analysis measurement mode provides display of AM, FM, and PM modulated signal spectra, along with analysis of related parameters. The main types of signal displays and parameter measurements are as follows:
-
RF Spectrum: Similar to the spectrum analysis mode, it displays the frequency spectrum of the modulated signal, allowing measurement of the occupied bandwidth.
-
Audio Spectrum: Displays the frequency spectrum of the demodulated audio signal.
-
Audio Waveform: Shows the time-domain waveform of the demodulated audio signal.
-
Parameter Analysis: Enables measurement and analysis of various parameters of the modulated signal, including carrier power, modulation rate, carrier frequency deviation, modulation depth (AM), frequency deviation (FM), phase deviation (PM), SINAD (signal-to-noise and distortion ratio), modulation distortion, total harmonic distortion, and more.
|
Rich Measurement Options – USB Power Measurement (Optional)
The USB power measurement function allows for the measurement of continuous wave signal power up to 40 GHz by using external USB power sensors from Ceyear's 87230/87231/84232/87233 series. This feature enables precise power measurements for high-frequency signals through a convenient USB interface, facilitating accurate testing and analysis in a wide range of applications.
|
|
|
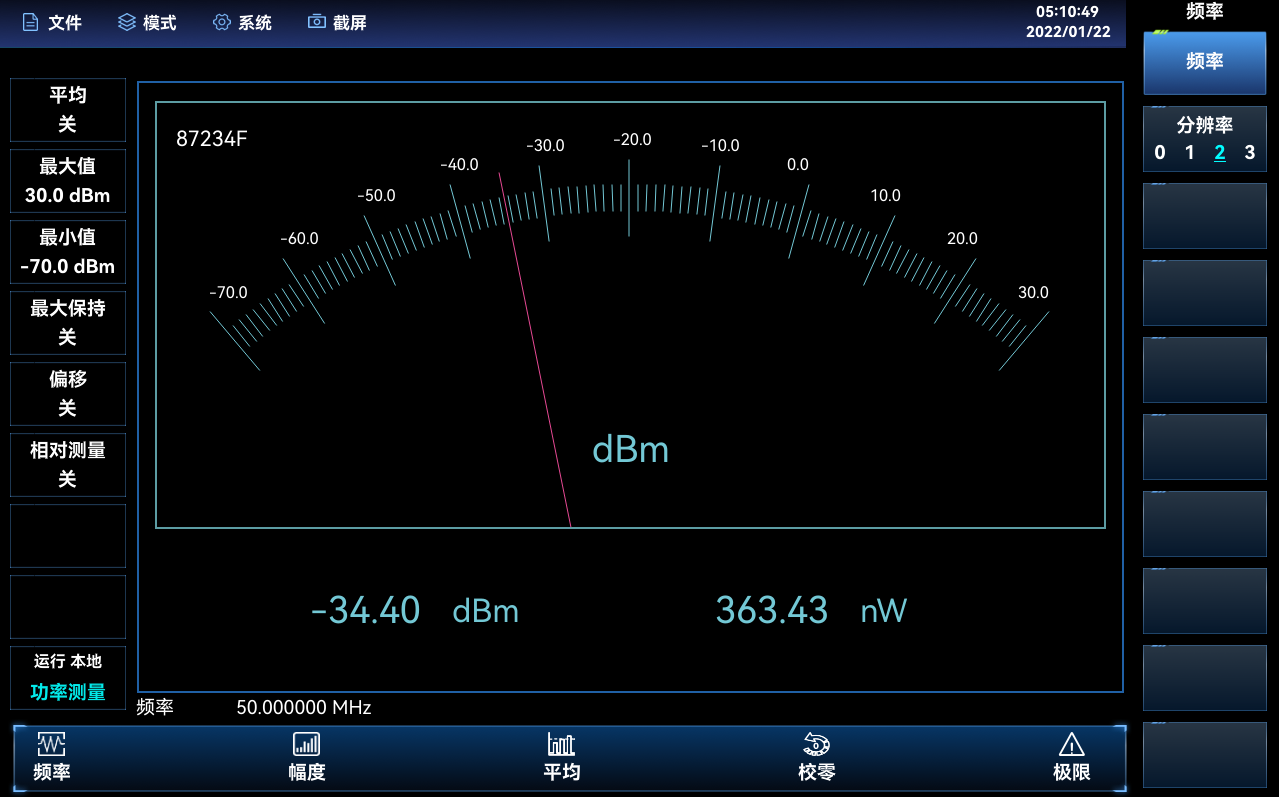
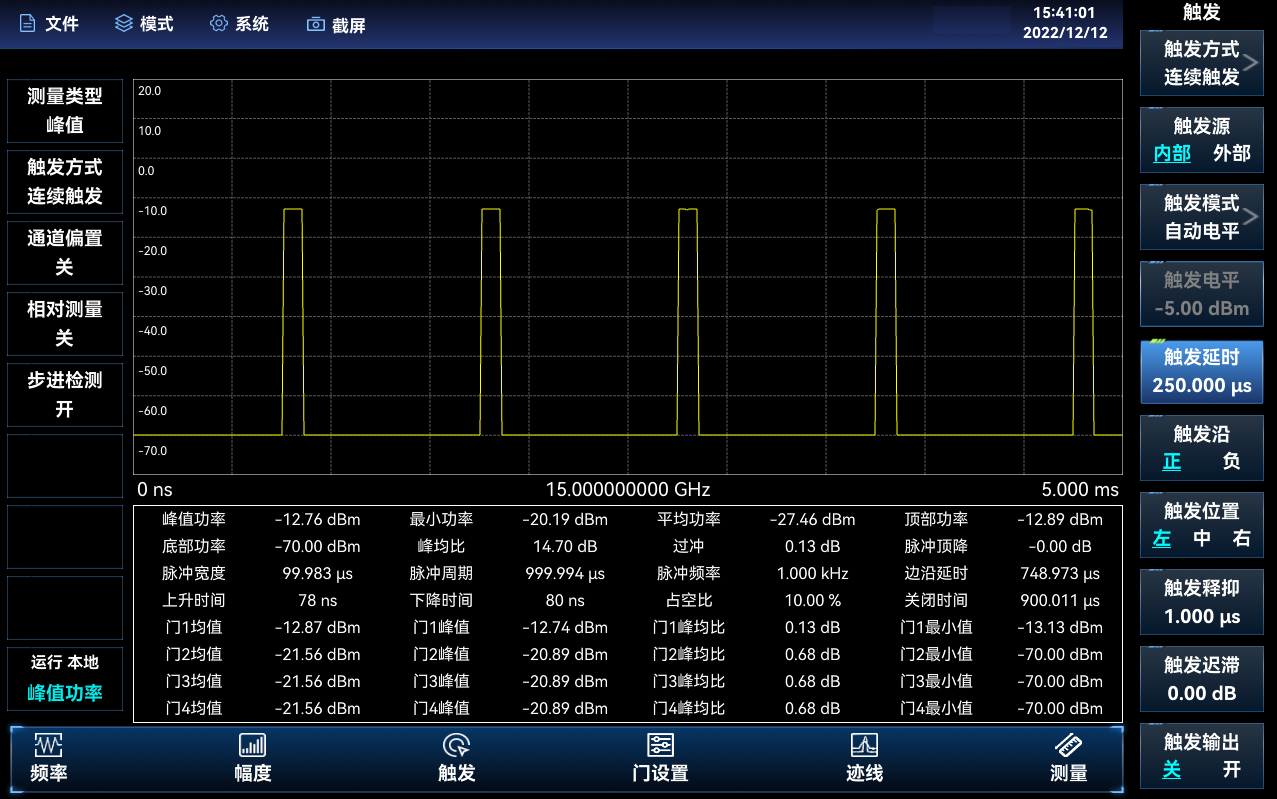
Rich Measurement Options – USB Peak Power Measurement (Optional)
By connecting Ceyear's 87234D/E/F/L USB peak power sensors via the USB interface, the instrument can measure RF/microwave signals up to 67GHz, enabling high dynamic range pulse power measurements. This function provides accurate characterization of fast-changing signal peaks, making it ideal for analyzing pulsed or modulated signals in advanced communication and radar systems.
|
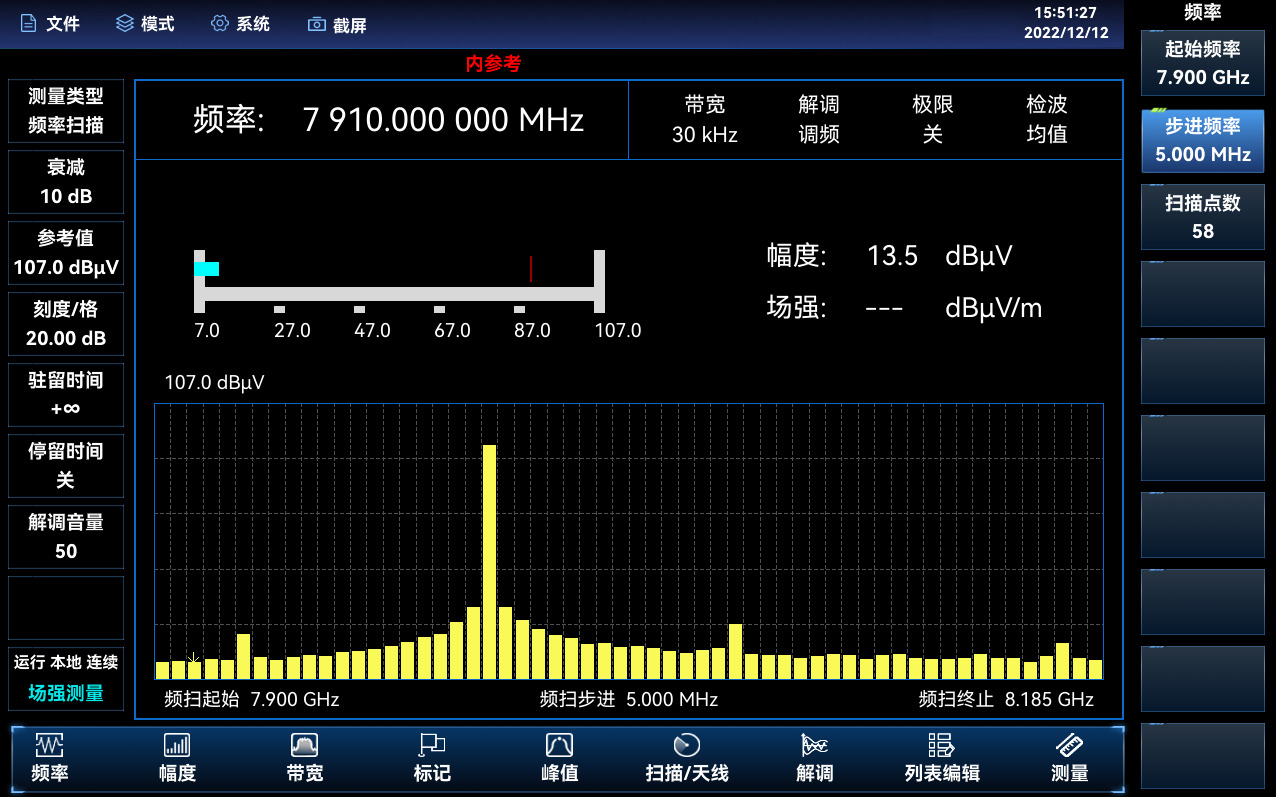
Rich Measurement Options – Field Strength Measurement (Optional)
Field strength measurement is available in three modes: fixed-frequency measurement, frequency sweep measurement, and list sweep measurement.
In fixed-frequency measurement, a specific frequency is set to observe the frequency offset, amplitude value, and field strength at that point.
In frequency sweep measurement, the start frequency, step frequency, and number of sweep points are set to observe variations in amplitude and field strength across a frequency range.
In list sweep measurement, a predefined or saved frequency list is used to observe the amplitude and field strength at each specified frequency point in the list.
|
|
|
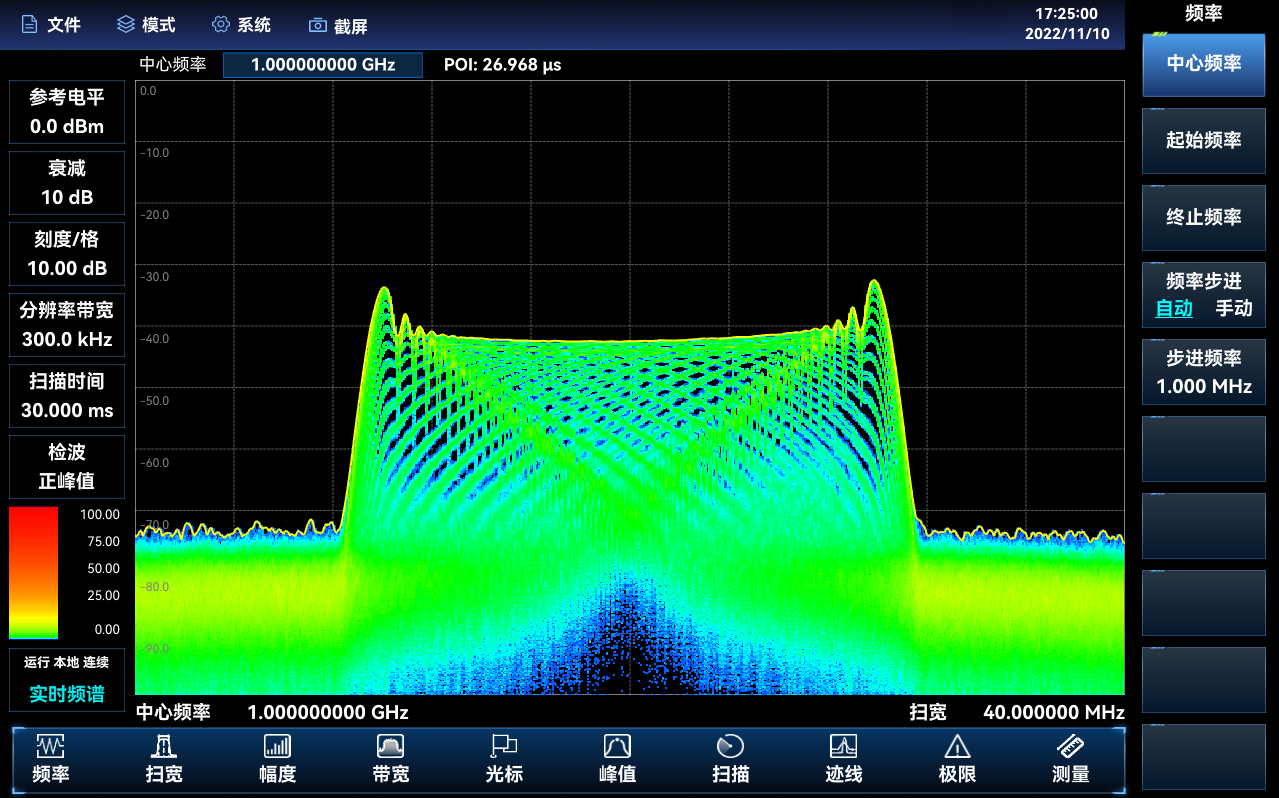
Rich Measurement Options – 40 MHz Real-Time Spectrum Analysis (Optional)
The real-time spectrum analysis function is mainly used for capturing and analyzing transient time-varying signals and burst signals. With a maximum real-time analysis bandwidth of 40 MHz, it enables measurements such as digital persistence and waterfall display for transient signals, providing deep insight into signal behavior over time.
|
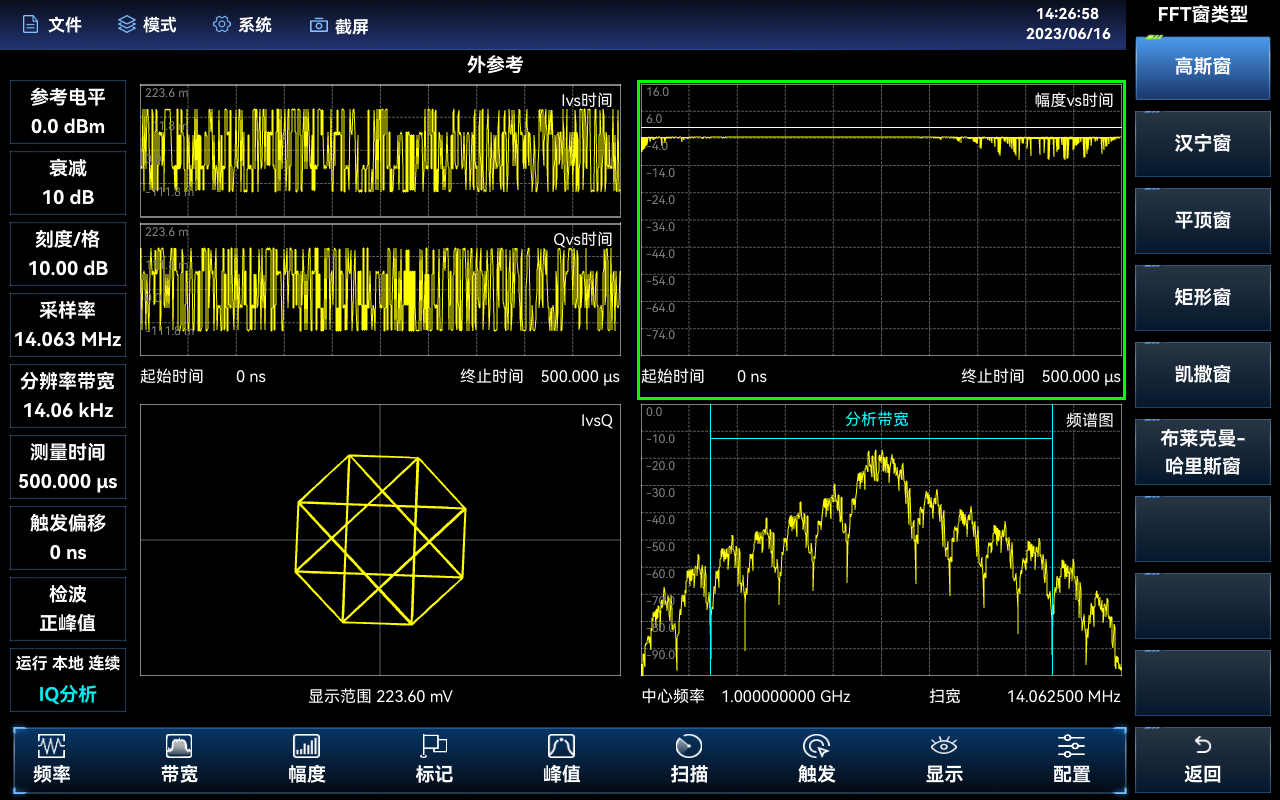
Rich Measurement Options – IQ Analysis (Optional)
The IQ analysis option supports the capture and display of IQ data, and provides various graphical display modes including IQ vs. time, amplitude vs. time, spectrum view, and I vs. Q diagrams for comprehensive signal analysis.
|
|
|
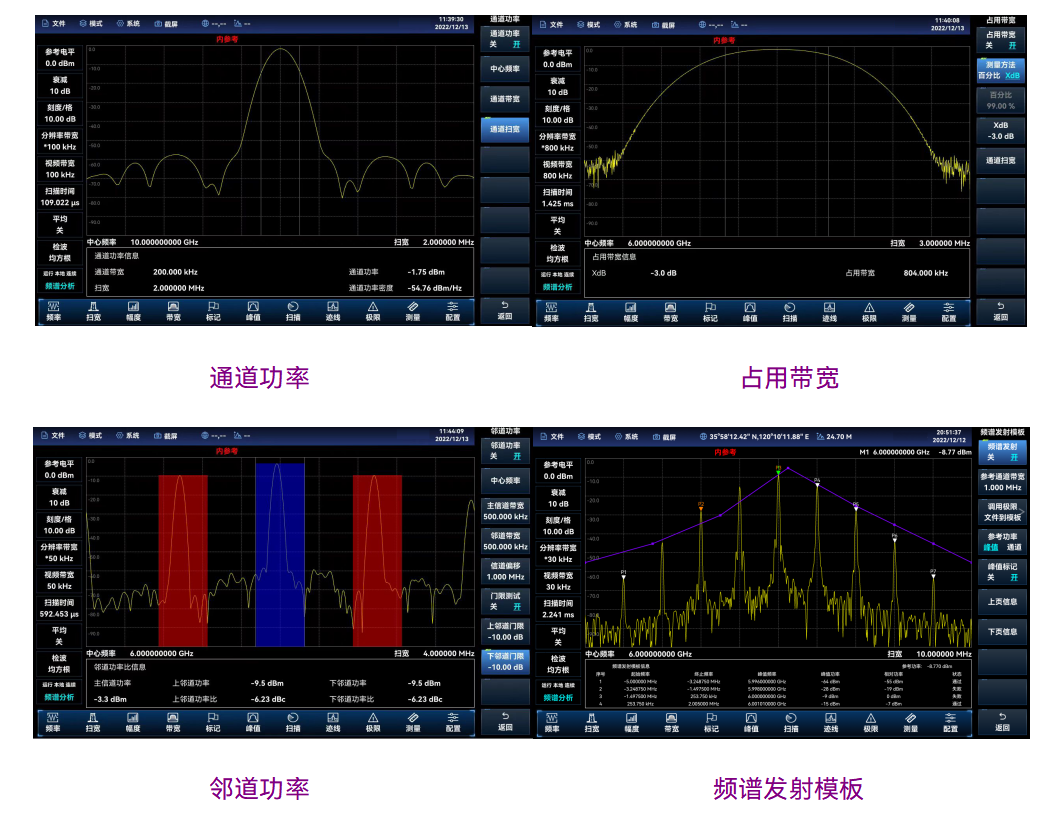
Comprehensive Intelligent Measurement Functions - 1
-
Channel Power
-
Occupied Bandwidth (OBW)
-
Adjacent Channel Power (ACPR/ACLR)
-
Spectrum Emission Mask (SEM)
|
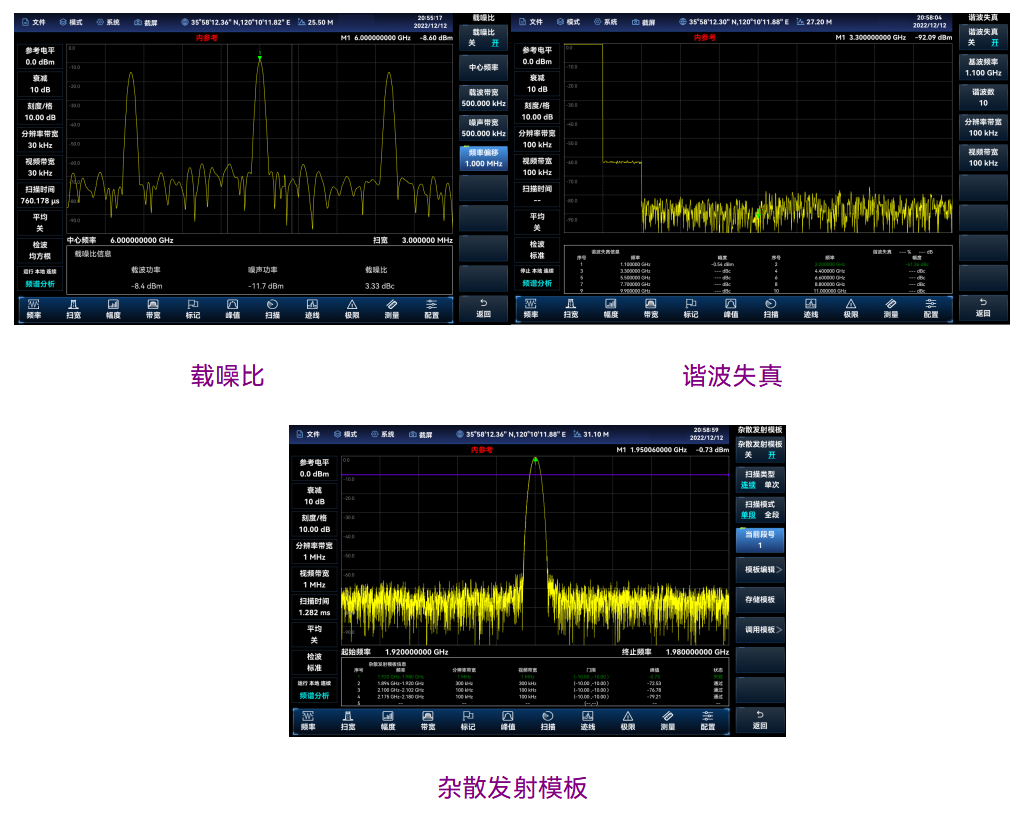
Comprehensive Intelligent Measurement Functions - 2
-
Carrier-to-Noise Ratio (C/N)
-
Harmonic Distortion
-
Spurious Emission Template
|
|

 +86 18988756718
 WeChat